
Introduction
We introduced the Butterfly Portfolio (BP) with a deeper, more technical piece than usual. This is the simplified version.
Why the Butterfly?
Optimal risk-adjusted returns come from multi-asset portfolios
The BP serves as the cornerstone of our proprietary risk tools
The Butterfly Blueprint:
20% Stocks
20% Bonds
20% Gold (fiat alternatives)
20% Hard Assets
20% Cash
Why BP Stands Out?
A barbell approach to protect against extreme inflation and/or deflation
Based on a 100-year back-test
BP vs. 60/40: The Results
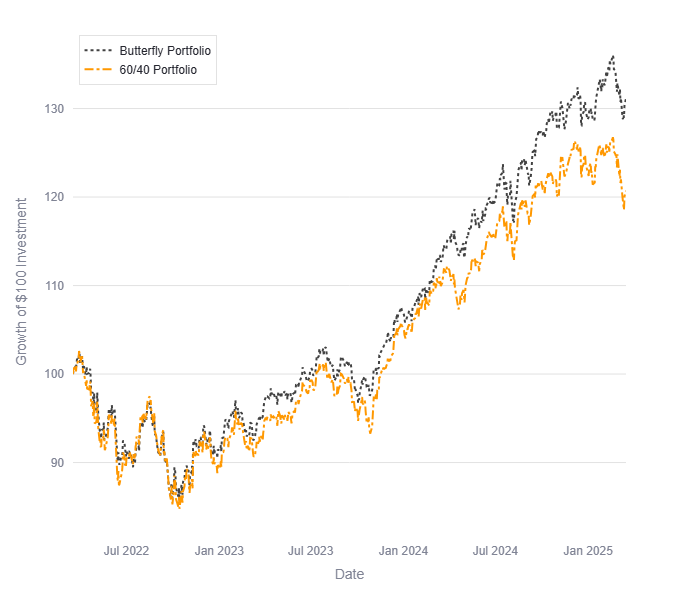
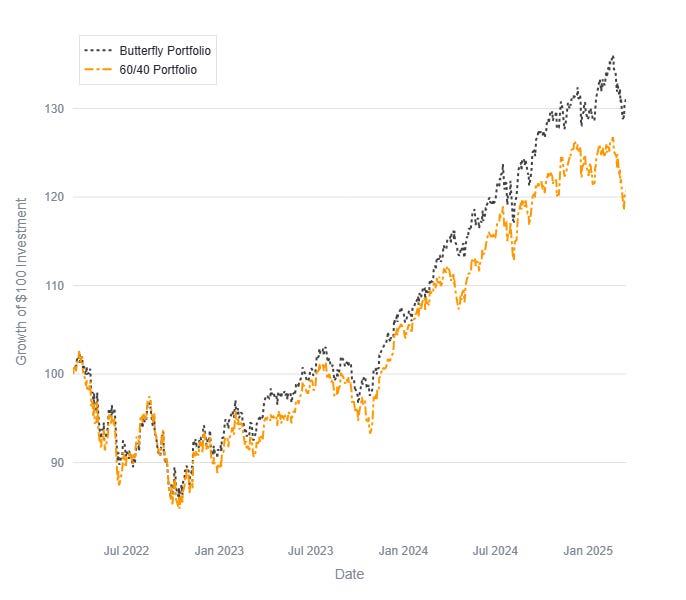
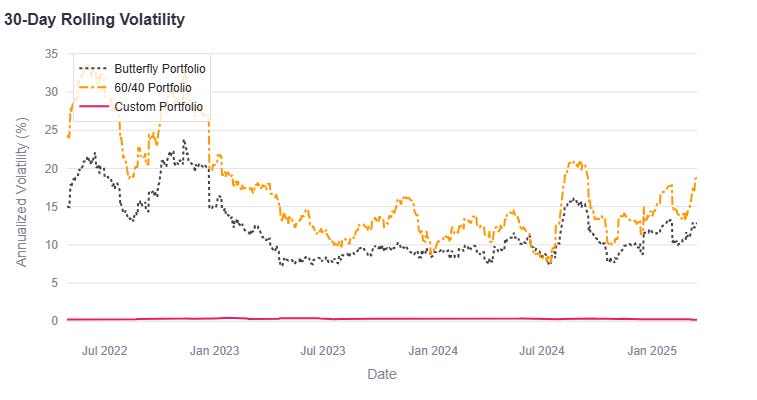
Here is the BP vs. 60/40 growth and volatility charts over the last 3 years (better returns and lower volatility):
Why It Matters:
This is a risk management story -- risk is opaque and complex, often overlooked in the decision-making process
Having a baseline portfolio allows us to calculate and simplify risk tools
Next Steps:
We have a new way to see and measure risk
Our first tool is coming soon -- the Multi-Asset Calculator
For the first time, you’ll be able to see your risk
Build it. Live it. Protect it.